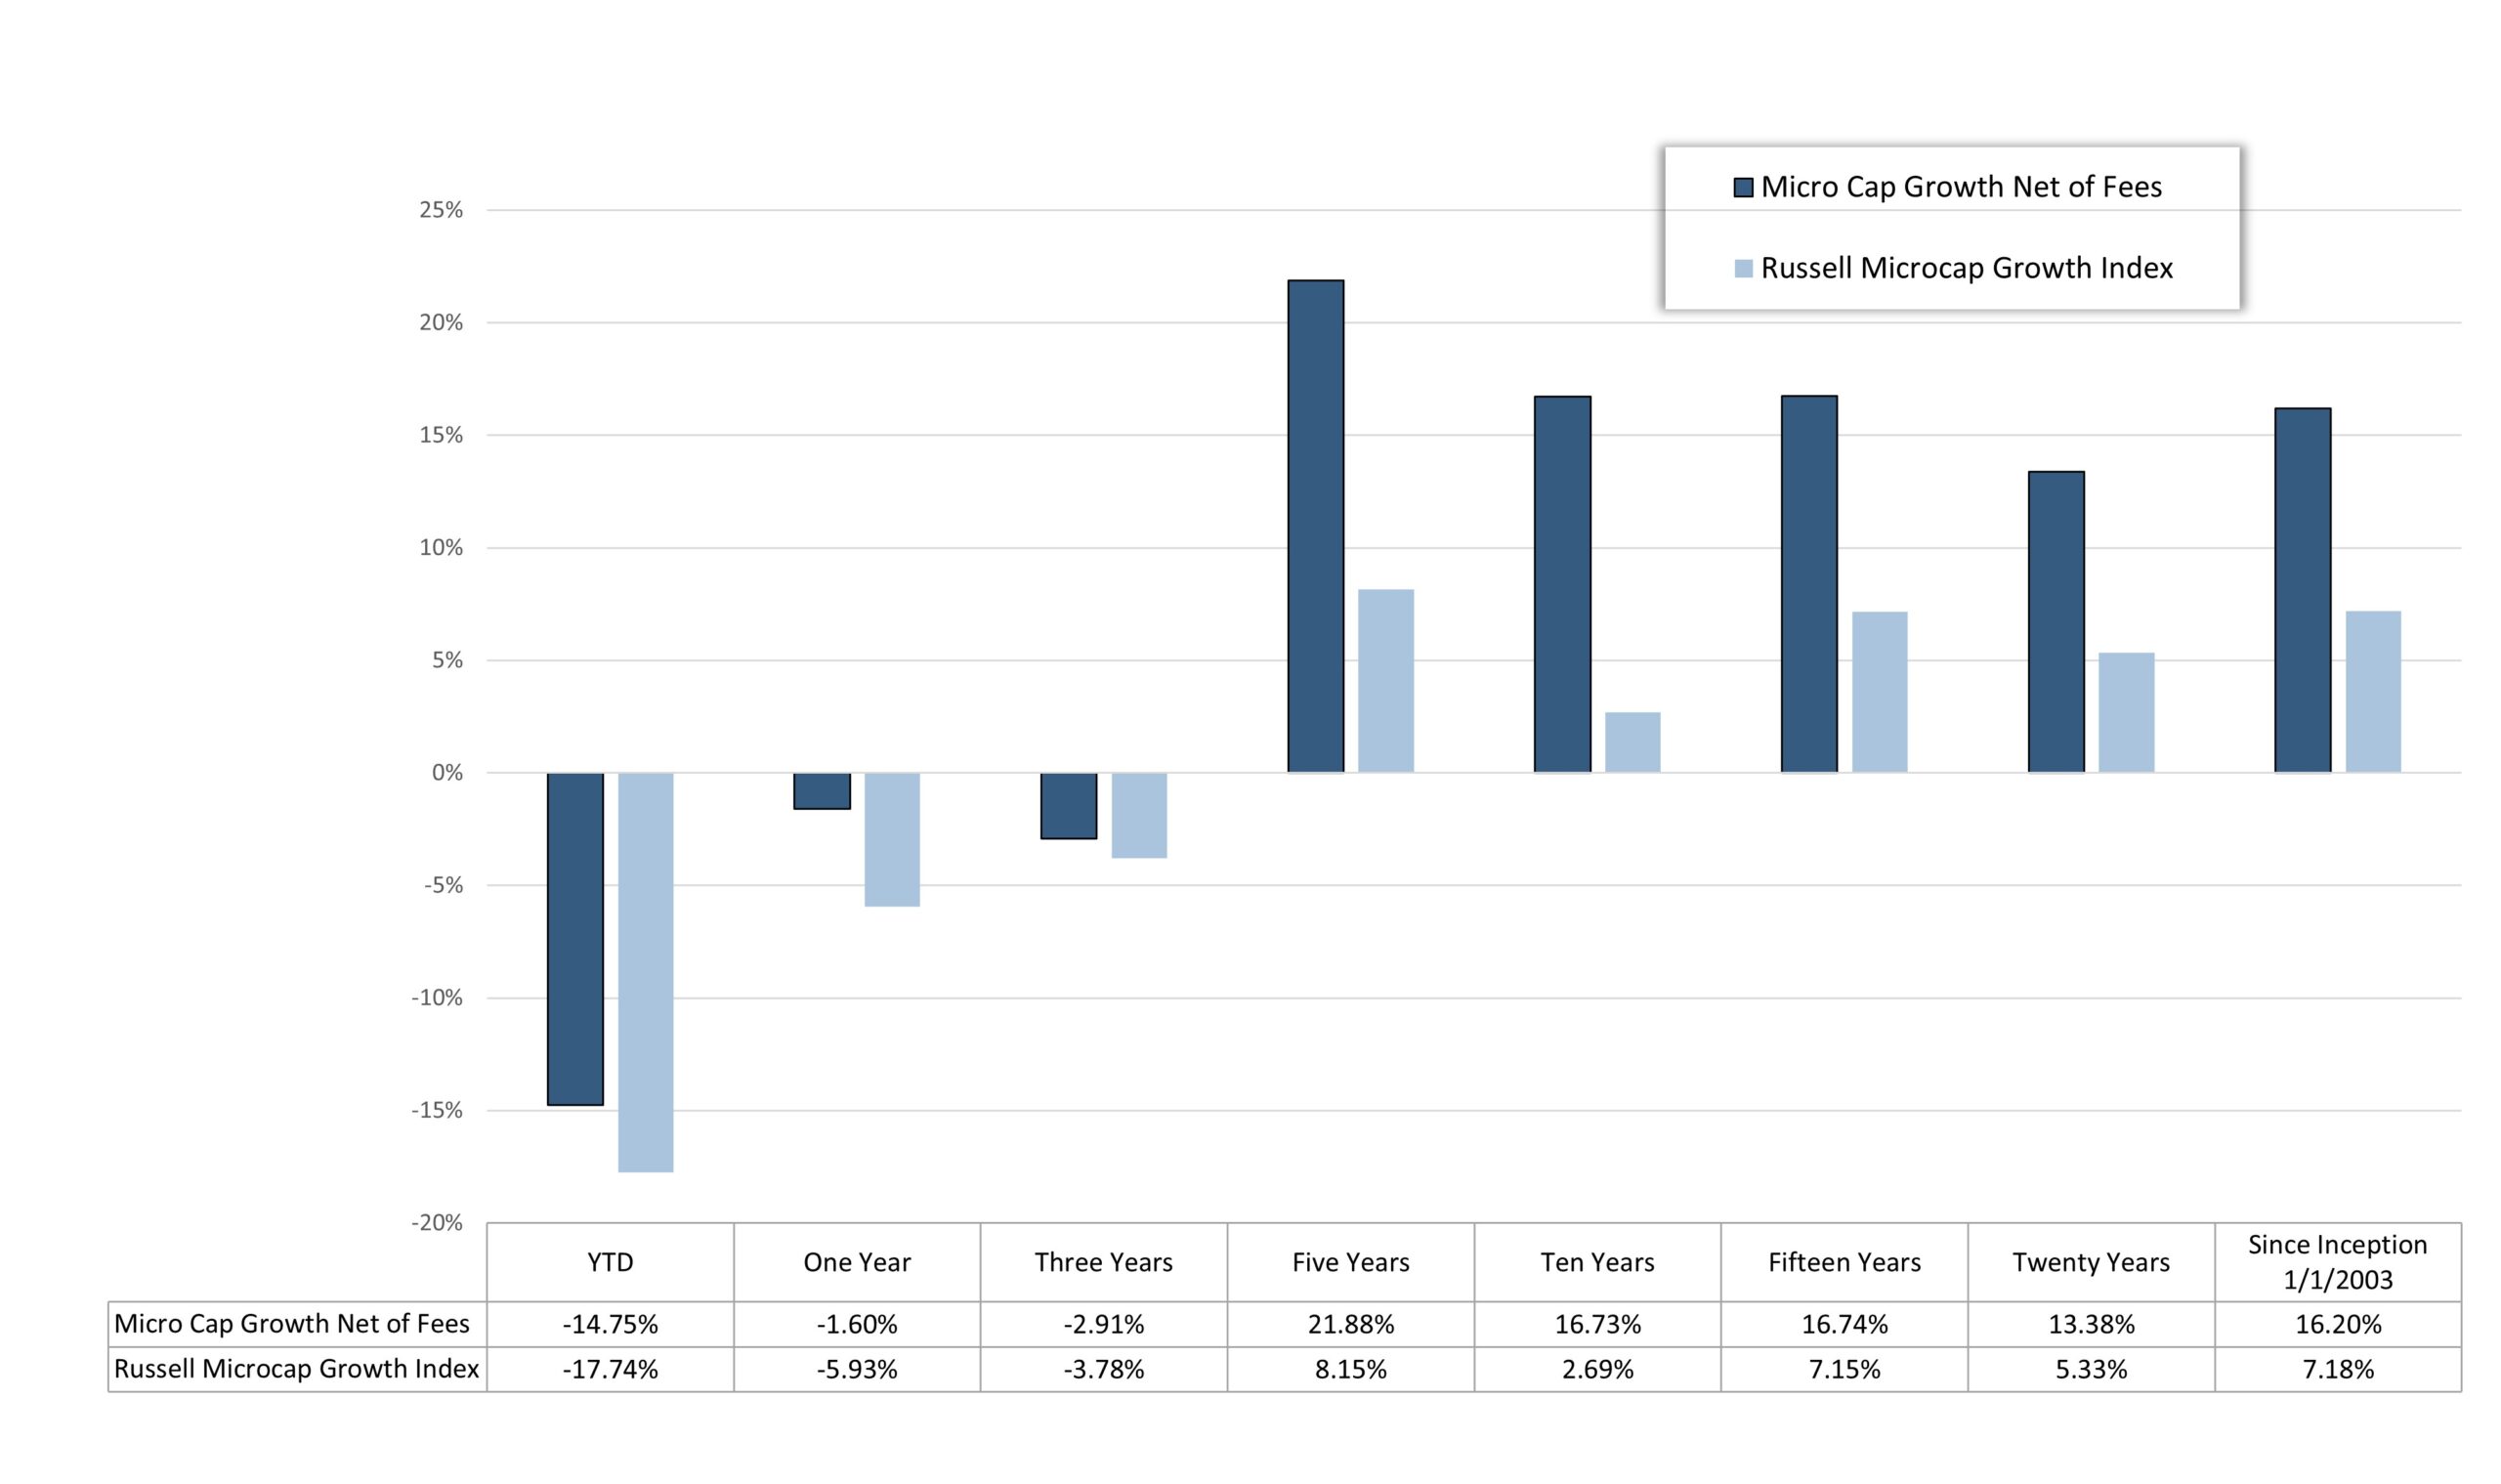
NCG Micro Cap Growth Strategy
Strategy Overview
We seek to generate long-term capital appreciation by investing in the fastest-growing and highest-quality companies in the US micro cap growth universe
Key attributes in our investments
- Superior Revenue Growth
- Large Market Opportunity
- Leadership/Disruptive Position in the Market
- Strong Management Team
- Strong Future Cash Flow Generation
Quick Facts
Portfolio Managers: NCG Team
Benchmark: Russell Microcap Growth Index
Number of Securities: Approximately 40-60
Inception Date: January 1, 2003
Strategy Assets: $431M (As of 03/31/2025)


